Showing posts with label infographic. Show all posts

Monday, September 23, 2013

Make Your Customers’ Day or They Will Make Yours!


“Make your customer’s day”- a well-known statement used for all customer types. And many people will agree if we don’t make our customers happy, they can make our lives complicated. What can be worse than a negative word-of-mouth? Lost customers not only affect your business, but also prevent from attracting new customers.

But keep in mind that unhappy customers are like competitors, they give you an opportunity for change and improvement, they can even give birth to new ideas. Win back every single customer or it will cost your business lots.

In evidence to this I’d like to share an Infographic with some stats on poor customer experience and its cost:


Wednesday, May 8, 2013

The Traditional Support Channel Persists!

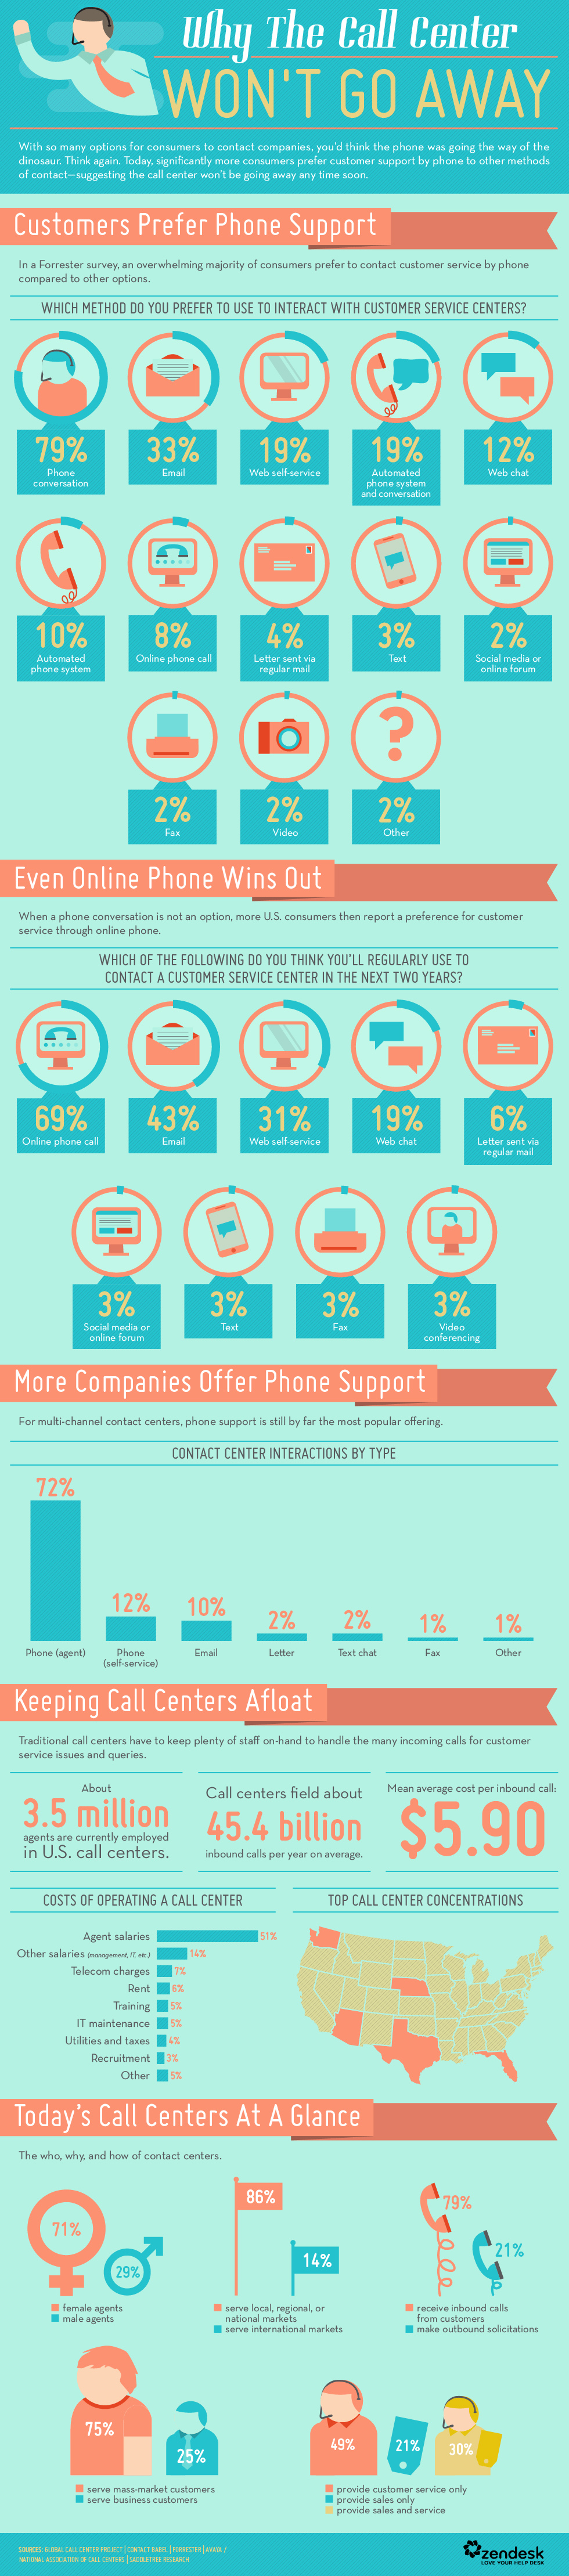
As a confirmation of my last post about call centers continuing to be the center of reliable and customer-friendly communication, I’d like to share an Infographic with some great facts and statistics by Zendesk:

  • 79% of customers still prefer to use the telephone to interact with a customer service center and only 12% prefer to use web chat (though that number continues to climb!)
  • 72% of companies are aware of their customers’ preference and place value on their call centers.
  • An interesting fact about agents’ gender: 71% of agents are female and only 29% male.

Clearly call centers will continue to play a big role in many companies’ success, driving high customer satisfaction scores and ongoing customer loyalty.


Call Centers Infographic